Version 1.0 Approx 0.8 MB (zipped) Last Updated 5 Aug 2023
This article was partly based on a Chart Reference Line question by JonathanT at AccessForums.net
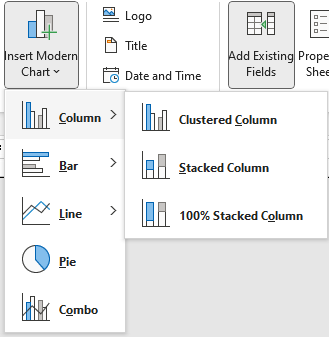
The 'modern chart' feature in Access includes a combo chart option which is very useful for plotting two sets of data on the same axes.
For example, the chart below shows two different sets of blood data (Cholesterol and Bilirubin) over a period of time
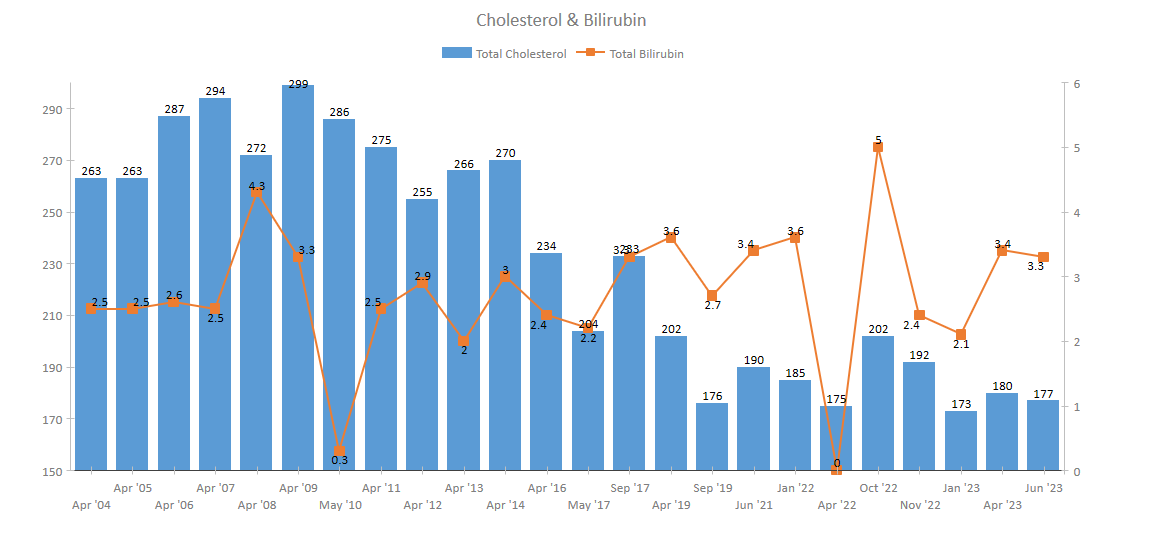
In the above example, the cholesterol levels are shown as a clustered column chart on the primary axis with the bilirubin levels as a line chart with values on the secondary axis. However you can combine any of the single chart types in a combo chart.
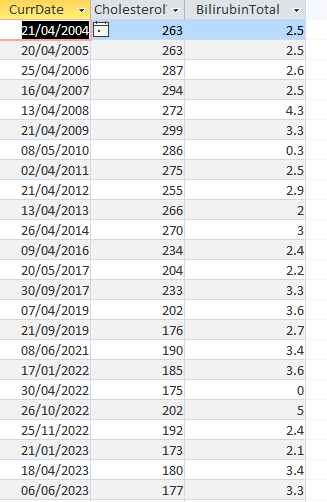
The two sets of data can be taken from a table or query

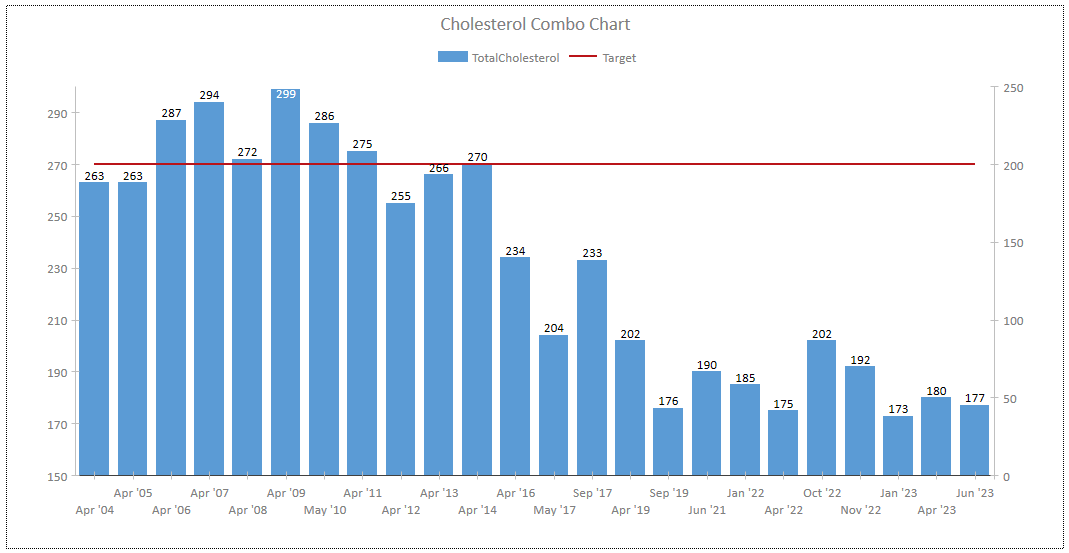
Combo charts are also useful where you only have one set of data but also wish to plot a reference line (as in the forum question linked above)
For example, in the example below the cholesterol data is plotted against a reference line showing the target level
There are several ways of achieving this, outlined below from worst to best.
a) Add an extra column to the query data with each record having the same value - in this case, 200
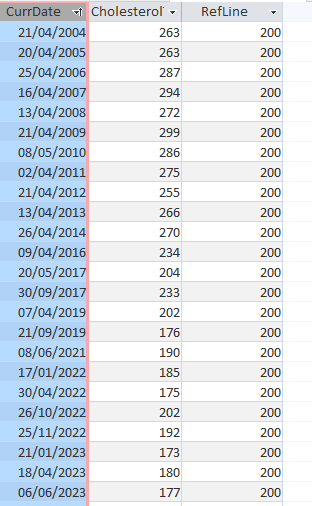
b) Create a separate table with one field and a single record and combine these as a cartesian (no join) query
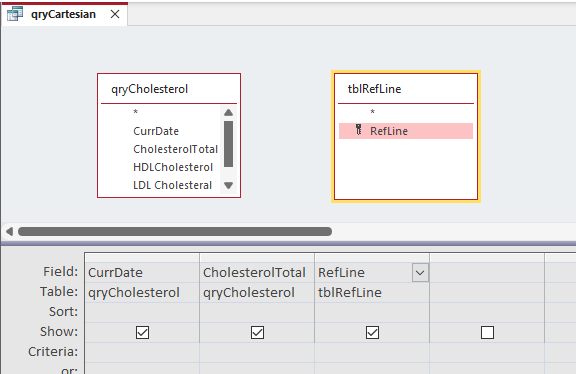
This creates the same dataset as above but has the advantage that you only need to change one line of data if the target level is changed
c) Use a TempVar to store the reference value. This is generated in the Load event of the form containing the chart

Use the TempVar as a field in the query used for the chart
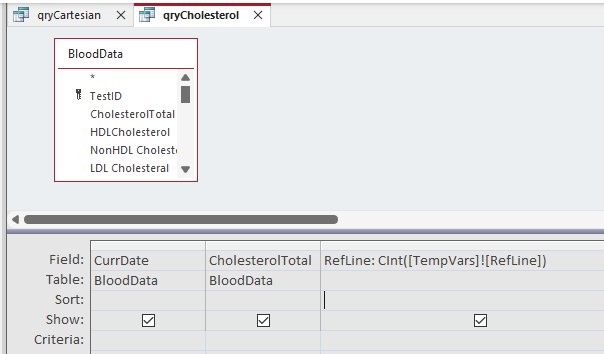
This has the advantage that no additional table is required. To edit the target level, just alter the code
NOTE:
1. If the query is run before the TempVar has been created by the form, an expression error will occur

This can be avoided by creating the TempVar when the app is first opened - in the startup form or an autoexec macro
2. Due to an Access bug, TempVars cannot be directly used in queries as that would result in unusable 'Chinese characters'.
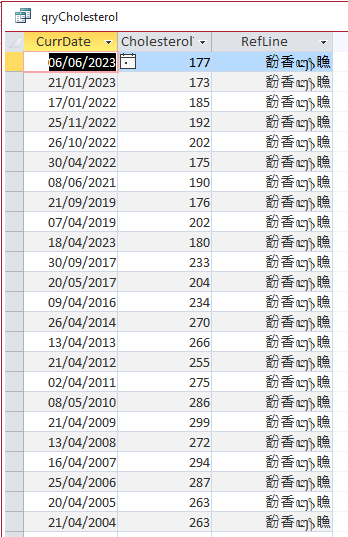
To avoid this, the TempVar value must either be cast as a specific number type using e.g. CInt (integer) as shown above or formatted using a function:
e.g. Round([TempVars]!RefLine], 1) where 1 = number of decimal places required
3. This article is based on the use of 'modern charts'.
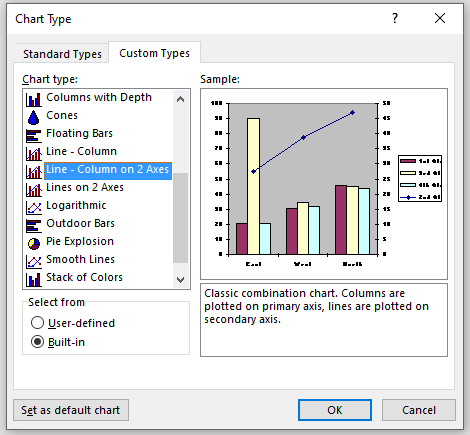
The older 'classic charts' have an equivalent feature called Line-Column charts but these are 'buried' in a list of custom chart types

Download
Click to download: Combo Charts ACCDB file (zipped)

Further reading
See the Microsoft help article / video: Combo Charts

Feedback
Please use the contact form below to let me know whether you found this article interesting/useful or if you have any questions/comments.
Please also consider making a donation towards the costs of maintaining this website. Thank you
Colin Riddington Mendip Data Systems Last Updated 5 Aug 2023

|
Return to Example Databases Page
|
Return to Top
|