AEU Meeting Date 5 July 2023 Last Updated 18 July 2023

Definition:
A Gantt chart is a type of bar chart used to display a project schedule. These were designed and popularized by Henry Gantt around the years 1910–1915.
Modern Gantt charts also show the dependency relationships between activities and the current schedule status.
Tasks to be performed are shown on the vertical axis, and time intervals on the horizontal axis.
The width of the horizontal bars in the graph shows the duration of each activity.
Topic outline:
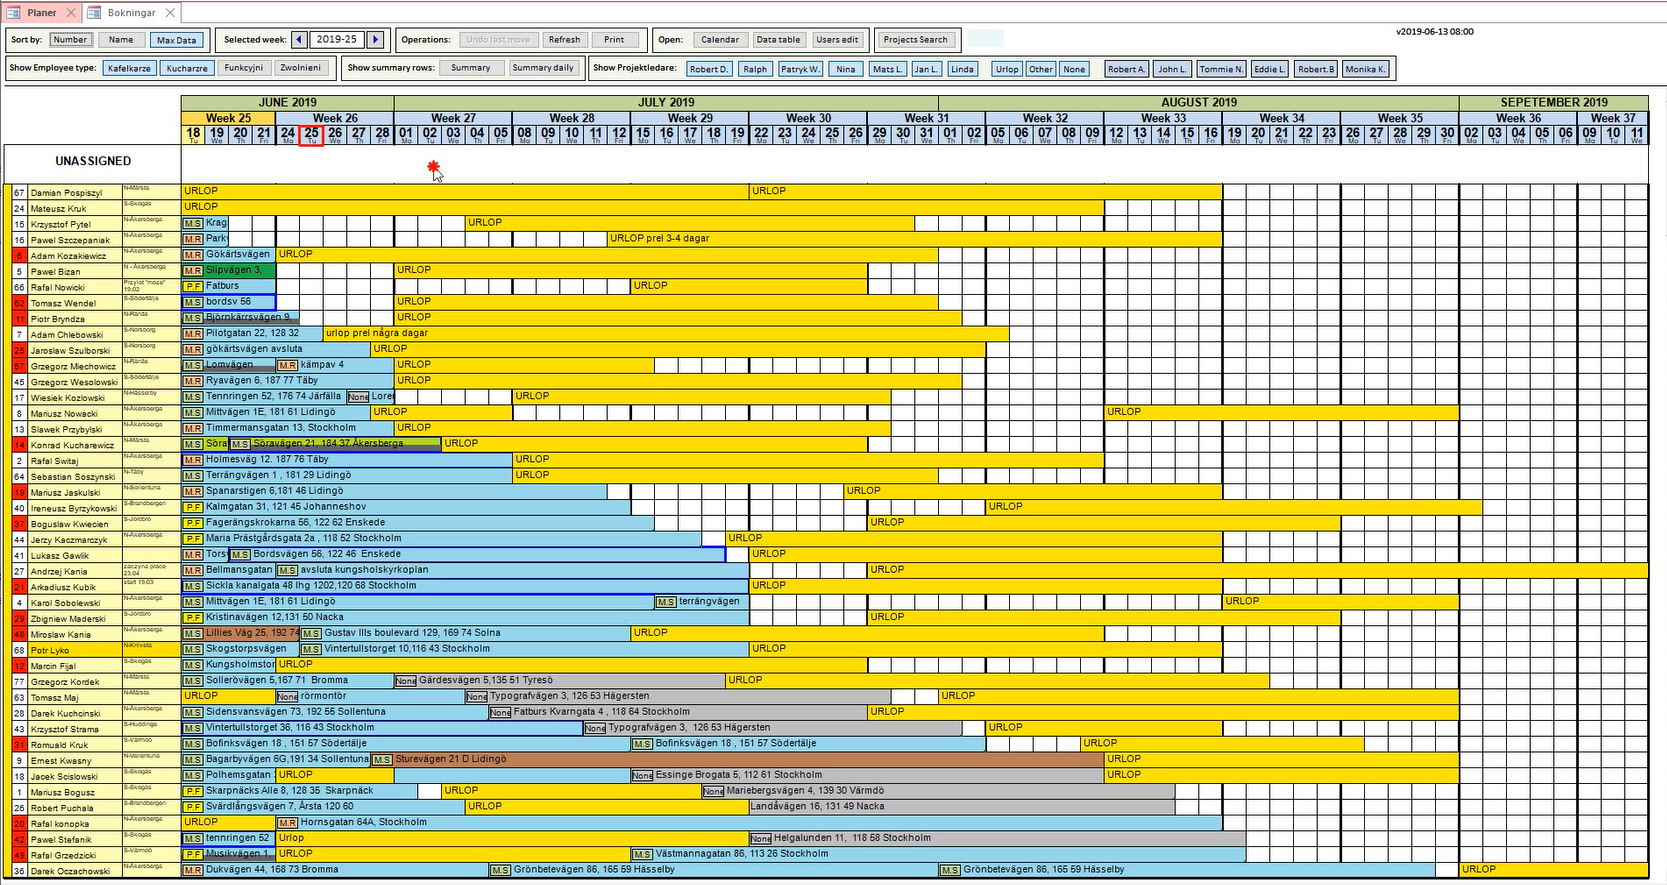
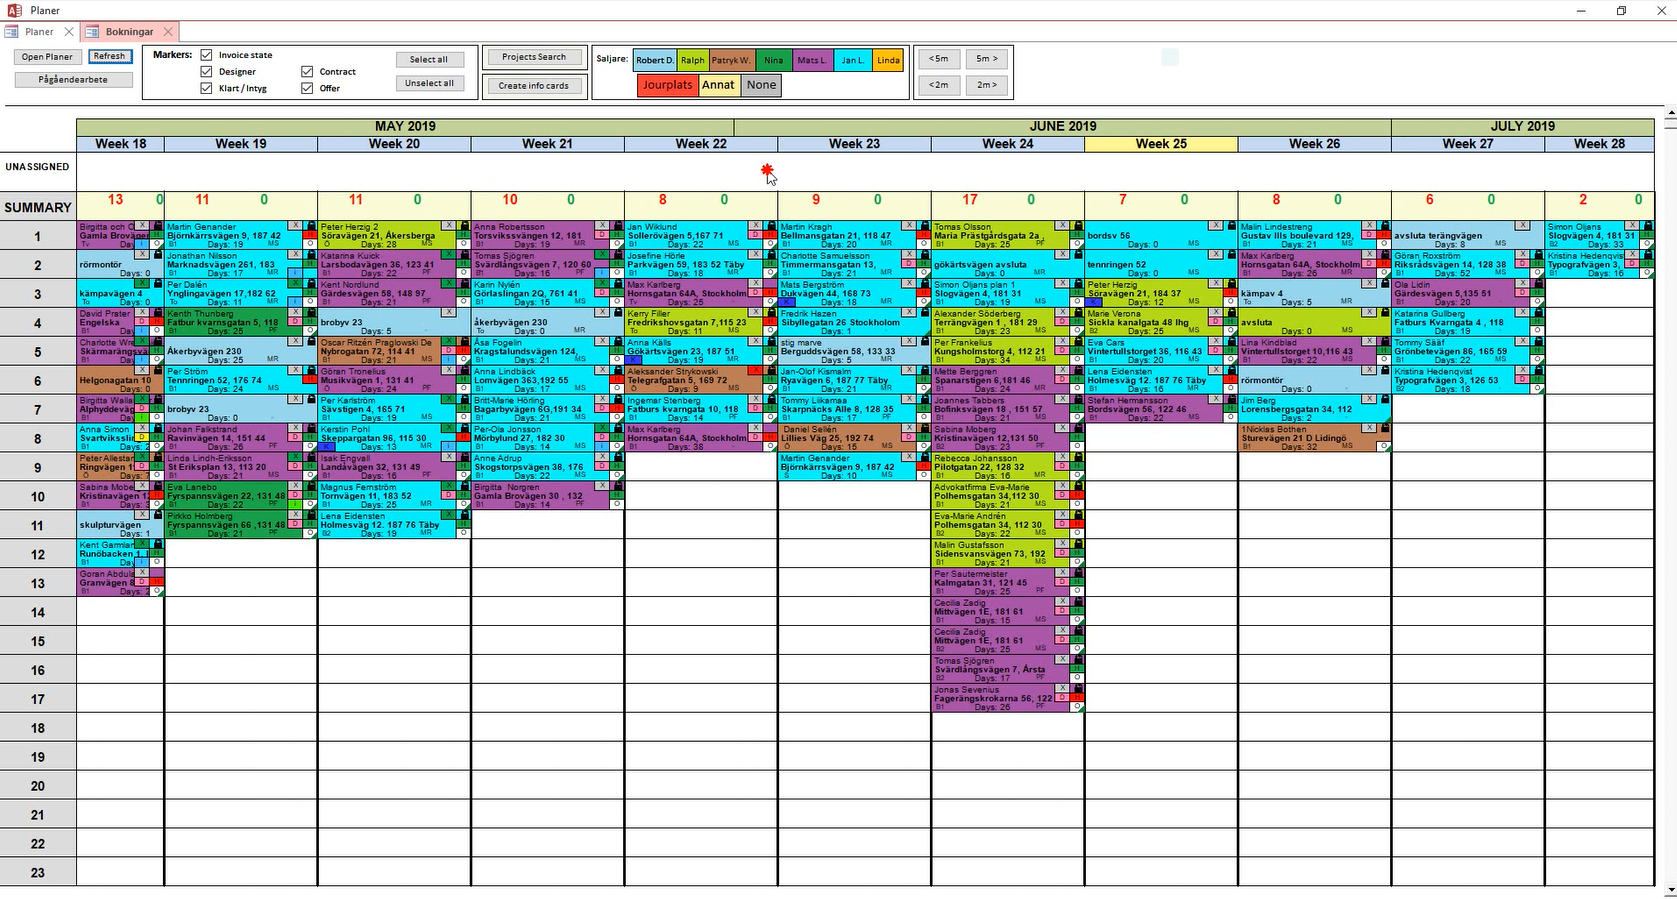
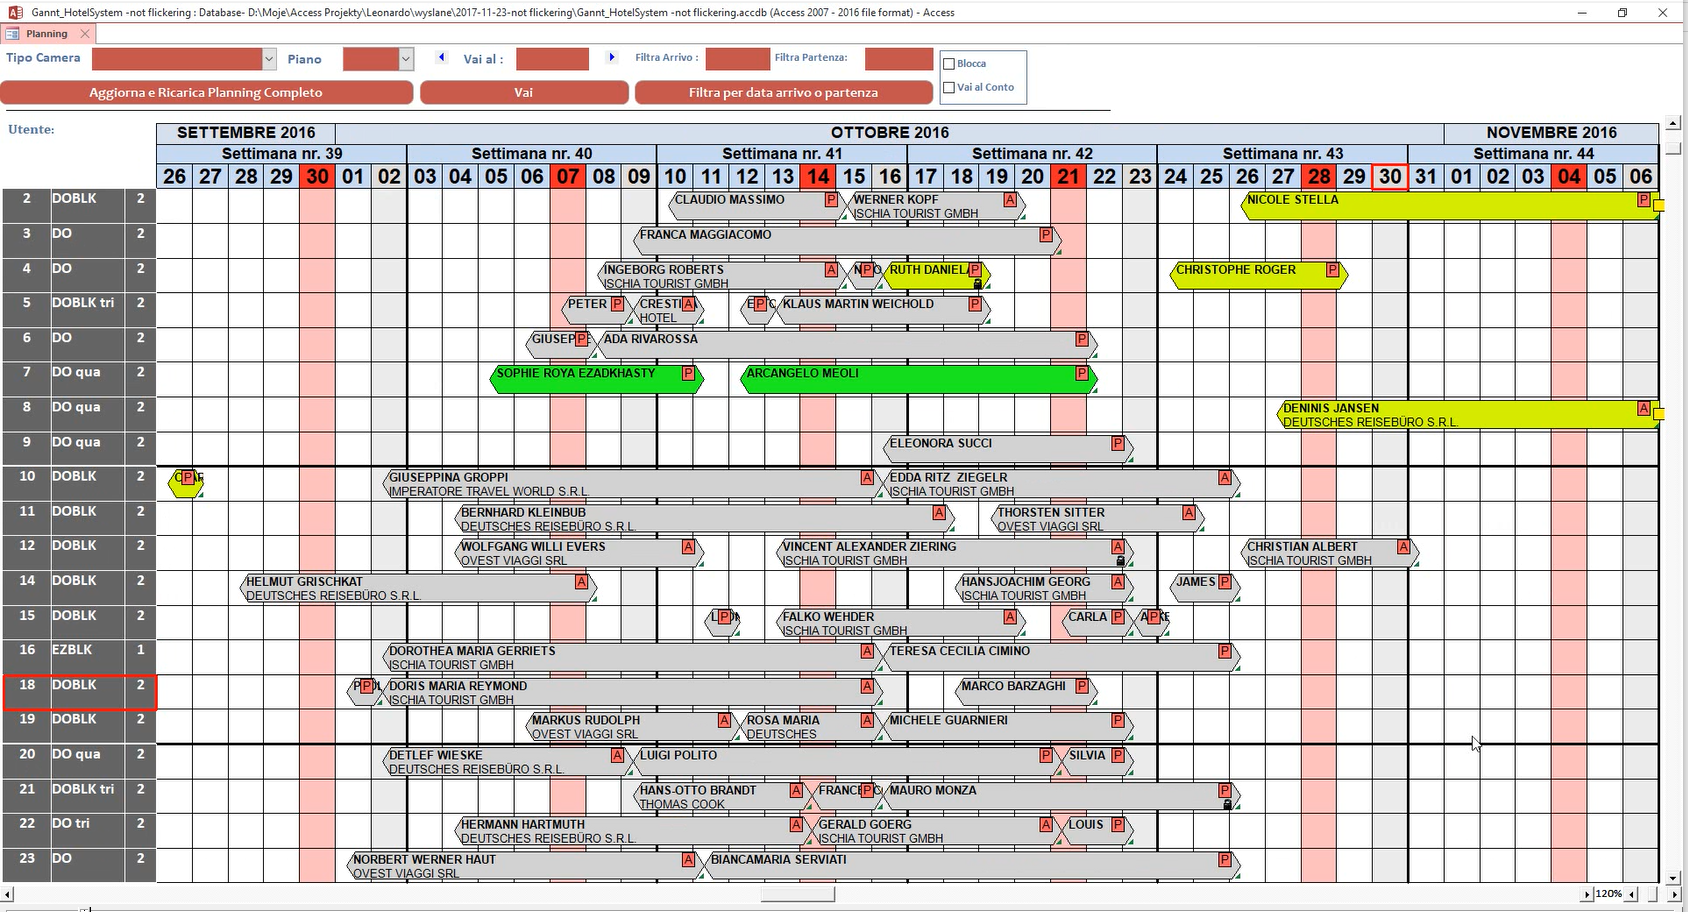
In many database solutions, there is often a need to present data in the form of a Gantt chart.
For example, in the processes of production planning, team task management, hotel room reservations etc.
It is also convenient to edit this data interactively on the chart, as this allows you to handle possible collisions and manage the overload of certain resources etc.
In this session, Aleksander Wojtasz will demonstrate how creating interactive Gantt charts for Microsoft Access makes it easy to manage such database solutions.
1. Brief explanation – how the solution works
a) Draw: Library that allows drawing in real time on Access form using gdi32 API function calls
b) Capture mouse position + mouse down/up clicks – standard events: mouse move, mouse down, mouse up
2. Deeper Description of Graphical Library
a) Starting point – Stephen Lebans clsPictureBox library form
b) What is gdi32? Brief explanation
c) How we can call the gdi32 library (invoke library function calls with use Declare)
d) How the library transfers output image created in memory area into Access Image Control
e) Basic draw operations:
- setting the pen: line width, line style, line color
- setting the brush: fill color, fill style
- setting the font : font name, size, style (bold, italic)
- draw lines / rectangles
- draw text (text rectangle, alignment, line split)
- draw small pictures (buffered small icons) in the main picture
3. Deeper Description of Mouse Events on Access forms
a) mouse down, mouse up, mouse move – events
b) positioning – convert twips to pixels
4. Putting everything together
a) create data structures for Gantt Chart (use of Scripting.Dictionary to keep data records in memory)
b) Sample drawing procedures
c) Integrate drawing (refresh procedures) with mouse events
This is a very innovative use of Access and the session was very popular
Example Screenshots
Aleksander Wojtasz (Biography):

– Based in Warsaw, Poland
– Active as MS Access programmer since 2005
– Working mostly as software developer in production companies – creating bespoke solutions to solve specific problems or cover very specific business processes.
– Last 4 years working mostly for financial banking company.
– Areas of interest: Using Access in both standard and atypical ways
– Big fan of web browser solutions: HTML+CSS+JavaScript
Meeting Details:
We use Zoom as our meeting application. Please click this link to Get Zoom if you don’t already have it.
When the time comes for the meeting, please use the following link: Join Zoom Meeting
. If you are asked: Meeting ID: 924 3129 5683 ; Passcode: 661210
For more connection options, please see the AccessUserGroups.org web page for this event
All sessions are recorded and later uploaded to the AccessUserGroups channel on YouTube
If you do not wish to be part of the recording, please ensure your webcam and microphone are both switched off during the meeting
Downloads:
Click to download a PDF of the presentation used in this session together with the example ACCDB databases used:
AEU_17_Presentation PDF file - approx 1.5 MB
Demo_GDI_In_Access ACCDB file - approx 0.9 MB (zipped)
DEMO_Gantt_Chart ACCDB file - approx 1.5 MB (zipped)
Video:
The meeting was recorded and the video is now available on the Access Europe YouTube channel at https://youtu.be/_f85C9wxKrQ or you can click below:
Colin Riddington Mendip Data Systems Last Updated 18 July 2023
|
Return to Access Europe Page
|
Return to Top
|